

Strategic Realignment of Commercial Real Estate: A Product-Market Fit Analysis Using the Strategyzer Framework
By Robert Kroon
Summary

Creating Product Market Fit: A Zero Tenant Improvement (Zero TI) approach reduces the time between tenants, increases lease rates, and increases tenant retention.
The commercial real estate landscape is undergoing a structural transformation that transcends traditional cyclical volatility. As of early 2026, the industry has transitioned from a period of pandemic-induced uncertainty into an era of profound recalibration. For the modern asset manager, the fundamental challenge is no longer merely managing vacancy but diagnosing a deeper structural misalignment between physical assets and the evolving requirements of corporate occupiers.
This misalignment is best understood through the lens of product-market fit, a strategic concept pioneered by Alexander Osterwalder and the Strategyzer team, which posits that success is found only when a product's value proposition aligns seamlessly with the jobs, pains, and gains of a specific customer segment.1
In the current environment, the persistence of high vacancy rates—particularly in Class B and C office properties—and the widening spread between asking and effective rents are not just symptoms of a soft market; they are definitive signals of a lack of product-market fit.4 The traditional office building, once a mandatory container for corporate labor, is being "re-hired" by tenants for a new set of functional, social, and emotional jobs.3
Assets that lack the necessary infrastructure for these new roles become functionally obsolete, ultimately being classified as stranded assets. Understanding this transition requires an exhaustive analysis of the Strategyzer framework applied to real estate, a benchmarking of the time required to turn over space in a selective market, and a clear-eyed definition of when a property has reached the end of its productive life.
The Strategyzer Framework: Defining Product-Market Fit for the Built Environment
To analyze the current distress in the commercial real estate sector, one must first deconstruct the relationship between the property (the product) and the tenant (the market) using the Value Proposition Canvas. This tool, acting as a plug-in to the broader Business Model Canvas, allows asset managers to zoom in on the critical interface where value is either created or destroyed.1 Achieving fit is not a binary state but a spectrum of alignment that dictates whether a market "pulls" an asset into high occupancy or if the landlord must "push" it through unsustainable concessions.2
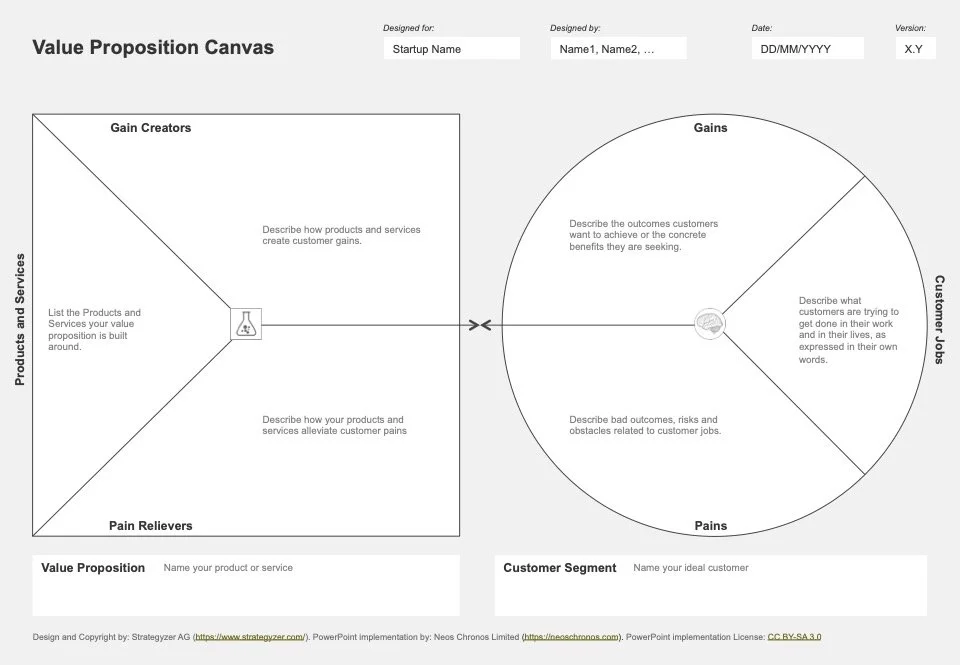
The Strategyzer Value Proposition Canvas is a tool for almost any strategic planning effort.
The Customer Profile: Decoding the Modern Occupier
The right side of the Value Proposition Canvas focuses on the customer profile, which in the real estate context consists of the corporate decision-maker and the employees they are trying to attract back to the office.2 The profile is divided into three dimensions: customer jobs, pains, and gains.7
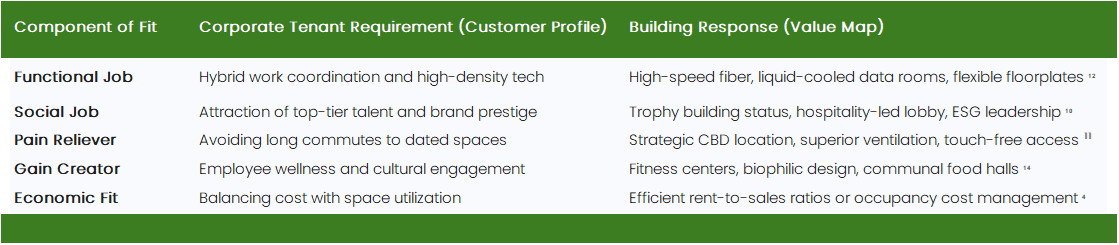
Customer jobs represent the tasks occupiers are trying to accomplish. In the pre-2020 era, the primary functional job was providing a desk and a network connection.10 In 2026, the functional job has shifted toward facilitating high-density collaboration, supporting hybrid work models, and meeting stringent environmental, social, and governance (ESG) mandates.12 Social jobs involve the office serving as a physical manifestation of corporate brand and prestige, helping the company look "organized and efficient" to clients and talent.2 Emotional jobs relate to employee well-being, safety, and the sense of purpose derived from a workspace that feels "worth the commute".11
Customer pains are the obstacles and risks tenants face.2 Currently, the most significant pains include the friction of commuting to uninspiring buildings, the financial risk of long-term lease commitments in a volatile economy, and the liability of occupying space that does not meet carbon-neutrality regulations.12 For many firms, paying for empty desks is a pain that signals a disconnect between real estate strategy and business reality, potentially wasting millions of dollars annually.4
Customer gains are the positive outcomes and "delighters" that tenants seek.3 These include superior air quality, seamless smart-building technology, integrated wellness amenities, and proximity to lifestyle destinations.11 Tenants are increasingly looking for space that helps them outperform competitors in the "war for talent".17
The Value Map: The Building as a Value Creator
The left side of the canvas, the value map, describes how the asset manager intends to satisfy the customer profile.2 It consists of products and services, pain relievers, and gain creators.3
The products and services are the tangible and intangible offerings, ranging from the physical floorplate and lobby to the property management team and the digital tenant experience app.1 Pain relievers are the specific features designed to eliminate tenant obstacles, such as flexible lease terms (e.g., three- to five- to seven-year terms instead of ten), spec suites that remove the friction of construction, and advanced HVAC systems that mitigate health concerns.4
Gain creators are the elements that produce the outcomes tenants desire, often exceeding expectations to create a "wow" factor.3 Examples include LEED Platinum certifications, rooftop terraces, EV charging stations, and concierge-level service.12
When the gain creators and pain relievers of an office building perfectly mirror the most important jobs, pains, and gains of the occupier, product-market fit is achieved.1
Diagnostic Indicators: Recognizing the Lack of Product-Market Fit
A CRE asset manager must be able to distinguish between a temporary market downturn and a fundamental failure of product-market fit. Fit failure occurs when the building is no longer "hired" by the market because its value proposition has become obsolete.2 Recognition of this state requires a move beyond lagging financial indicators toward a more holistic diagnostic framework.9
Quantitative Red Flags: Absorption, Retention, and the Retention Curve
The most fundamental quantitative indicator of fit failure is persistent negative net absorption. In 2025, Class A properties in many markets began to experience positive absorption, while Class B and C properties continued to lose tenants at a rate indicating a structural rather than cyclical decline.14 This trend is often referred to as the "flight to quality," but from a Strategyzer perspective, it is a massive migration toward better product-market fit.14
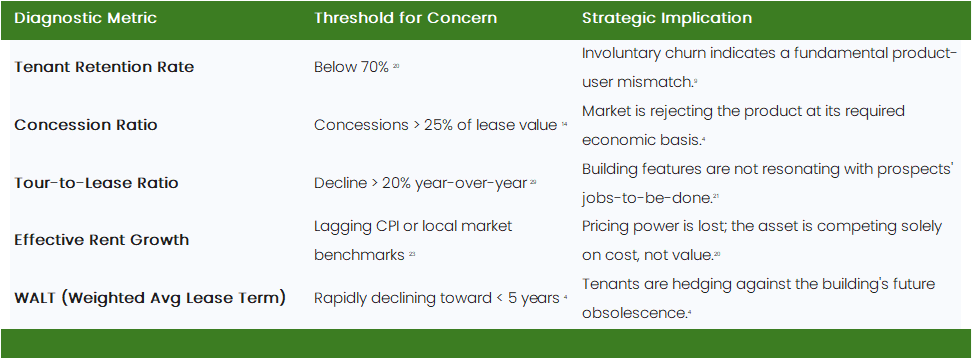
The retention curve is the purest indicator of fit.9 A healthy building should see a retention curve that drops initially at the end of lease cycles but eventually flattens into a plateau of loyal tenants.9 A bad retention curve never flattens; it decays continuously toward zero, suggesting that once a tenant's lease is up, they find no compelling reason to stay, regardless of the property's management or location.9 A retention rate below 70% is generally considered a red flag in the current market, signaling that the property is no longer meeting the needs of its core customer base.20
The Pricing Signal: Effective vs. Asking Rents and the Concession Spread
A lack of product-market fit is often masked by "revenue growth" driven by unsustainable discounting.9 Asset managers must scrutinize the spread between asking rent and effective rent. In the 2025 market, Class B and C landlords were increasingly forced to offer aggressive incentives, with concessions now accounting for an average of 26% of U.S. lease terms.14 When a landlord must offer six to twelve months of free rent and triple the traditional tenant improvement (TI) allowance just to maintain occupancy, the market is signaling that the building's inherent value does not justify its sticker price.11
Furthermore, the "brown discount" has emerged as a critical pricing signal. Assets with poor sustainability credentials are seeing their valuations decline as tenants and investors penalize buildings that pose an ESG risk.25 Research indicates that tenants are willing to pay a premium of up to 18–28% for office space that meets wellness and environmental criteria, further widening the gap between those with fit and those without.14
Qualitative Signals: Feedback Loops and the "Ghosting" Phenomenon
The qualitative indicators of fit failure are found in the feedback loops of the leasing process.22 If a building consistently loses prospects after the first property tour, the manager must analyze the "tour-to-lease" conversion rate.26 A low conversion rate often indicates that while the building's location (the "market") might be attractive, the physical reality of the space (the "product") fails to deliver on the initial promise.21
Common qualitative signals include:
Definitional Drift: Internal teams (leasing, management, and ownership) have conflicting versions of the building's target tenant or value proposition.9
Complex Sales Cycles: Leasing becomes an "uphill battle" where every deal requires bespoke modules or expensive structural changes that erode gross margins.21
"Invisible" Assets: In a digital-first market, buildings that lack a strong online presence and real-time behavioral data engagement are effectively invisible to the 89% of brokers who now rely on digital platforms for evaluation.5
Comparative Analysis of Transition Timelines: Class A vs. Class B
The time it takes to transition from one tenant to the next—often referred to as downtime or the "lease-up" period—is a direct function of product-market fit. In a market where high-quality space is in short supply, Class A properties experience a "pull" that accelerates transitions, whereas Class B properties suffer from a "push" that leaves them vacant for extended periods.5
Class A Dynamics: The High-Stakes Turn
Class A buildings, particularly "Trophy" assets, are currently characterized by a "selective" but active demand environment.5 Because these buildings align with the "flight to quality," they often maintain high occupancy even as the broader market struggles.14 However, the complexity of modern Class A requirements can lengthen the transition timeline.
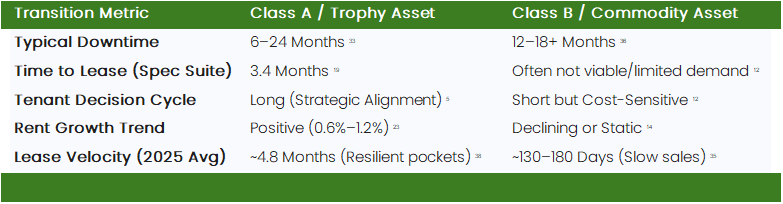
For a standard Class A office vacancy, the weighted-average downtime is currently projected to range between 6 and 24 months.33 This wide range is driven by several factors:
Strategic Decision Cycles: Large multinational tenants—the primary users of Class A space—take longer to finalize their workplace strategies, often involving multiple internal stakeholders.5
Customization and TIs: The "premium" nature of the space often requires significant tenant improvements to align with the occupier's specific culture and brand, which can take several months to design and permit.6
ESG Retrofitting: Increasingly, the gap between tenants is used by asset managers to perform critical ESG upgrades to maintain the building's competitive edge.12
The Spec Suite Revolution: Compressing the Timeline
One of the most effective strategies for reducing downtime in Class A assets is the development of spec suites—high-quality, pre-built office spaces that allow for immediate move-in.19 The data from 2025 shows a stark difference in leasing velocity for these spaces:
Spec Suites: Average time to lease is just 3.4 months.19
Customized/Shell Space: Average time to lease is 16.5 months.19
This nearly 80% reduction in downtime demonstrates that there is a significant segment of the market (often mid-sized professional services firms or government contractors) whose primary job-to-be-done is "speed to occupancy" and "minimal capital outlay".19 By pre-building the space, the asset manager is removing one of the primary "pains" of the leasing process: the uncertainty and delay of construction.19
Class B Dynamics: The Value-Gap Dilemma
The transition timeline for Class B properties is significantly more fraught. As tenants "right-size" or "trade up" to Class A space, Class B landlords are left with a shrinking pool of cost-sensitive prospects.11
In many major markets, Class B vacancy rates are as much as 15 percentage points higher than their Class A counterparts.11 Consequently, the "days on market" for a Class B space can frequently exceed 12 to 18 months, with some units sitting vacant for multiple years if they lack modern infrastructure.35 The "value-gap dilemma" refers to the fact that upgrading these buildings to compete with Class A can cost approximately $100 per square foot—an investment that many owners cannot justify or finance in the current interest rate environment.12
The Anatomy of a Stranded Asset: Defining the Point of No Return
A stranded asset is a property that once had value but no longer does due to external factors such as regulatory changes, environmental risks, or permanent shifts in consumer sentiment.18 In the Strategyzer lexicon, a stranded asset has reached "terminal product-market fallout"—the market has moved so far that no amount of pivoting within the original business model can restore its viability.21
The 50/1 Rule: The Threshold for Concession
For a CRE asset manager, determining when to concede that a property is a stranded asset is a critical fiduciary responsibility. While different organizations have varying risk tolerances, a common framework for identifying "underutilized" or "stranded" properties involves a two-part threshold:
Vacancy Rate: The property must have a minimum of 50% vacancy.41
Duration: The minimum length of this high vacancy or partial vacancy must be at least one year.41
Once a building crosses the "50/1" threshold—50% vacant for one year—it is no longer a performing asset but a liability requiring total repositioning, conversion, or demolition.16 At this point, the cost of carrying the asset (taxes, insurance, maintenance, and debt service) begins to compound the loss faster than any realistic rental income can offset it.4
Legislative and Regulatory Stranding: The Hard Stop
The most objective timeline for asset stranding is set by government regulation, particularly concerning energy efficiency and decarbonization. In the UK, for example, the timeline for commercial properties is absolute:
Currently: Minimum EPC 'E' rating required to let.16
2027: Minimum rating increases to EPC 'C'.16
2030: Minimum rating increases to EPC 'B'.16
Any building that cannot realistically be upgraded to these standards within the required timeframe is effectively a stranded asset from the moment the cost of compliance exceeds the asset's net present value.16 In the US, similar performance standards in cities like New York and Seattle are creating a "brown discount" that penalizes non-compliant buildings long before their leases expire.25
Economic Stranding and the Financing Maturity Wall
Stranding can also occur when a building’s capital structure collapses. By 2025, nearly 11% of office CMBS loans were delinquent, the highest since the global financial crisis.4 This financial distress is often a lagging indicator of a product-market fit crisis. As leases roll over between 2026 and 2028, owners of Class B and C properties face a "maturity wall"—a $929 billion wave of debt that must be refinanced.11
A property should be considered as a stranded asset when it meets the following criteria:
Negative Leverage: The interest rate on required debt exceeds the property's cap rate, and there is no clear path to achieving positive leverage within three years.42
TI/Rent Mismatch: If the tenant improvement costs required to secure a lease exceed 12 months of the expected rent, the deal effectively destroys value.30
Functional Obsolescence: The building's physical attributes (e.g., low clear heights in industrial, or deep windowless floorplates in office) make it impossible to meet modern occupier "jobs" like wellness or high-density tech infrastructure.12
Managerial Decision-Making: Strategies to Pivot or Exit
Once an asset manager identifies a lack of product-market fit or the onset of stranding, the Strategyzer methodology offers three paths: pivot, double down, or exit.21
The Pivot: Repositioning for a New Market
If the asset has "good bones" but the wrong value proposition, the manager can pivot by changing the product features to match a more viable market segment.21 In 2025, this often involved converting "commodity" office space into life-sciences labs, medical offices, or residential lofts—segments that are currently seeing a CAGR of 5.95% or higher in regions like Asia-Pacific and selective US submarkets.11
Key levers for a successful pivot include:
Amenity-led Strategy: Integrating wellness features, EV charging, and biophilic design to create a "holistic experience" that drives ROI.10
Spec Suite Acceleration: Using pre-built spaces to target the "speed-to-market" segment, thereby reducing downtime to under 4 months.19
Digital Engagement: Closing the "digital gap" by adopting AI-driven marketing strategies that increase property tours by 30% and closed deals by 18%.5
The Exit: Conceding the Stranded Asset
Conceding that an asset is stranded is often delayed by the "sunk cost fallacy" or the fear of explaining a massive reduction in company value to shareholders.9 However, the most successful boards are those that "analyze, take stock, and act" before the crisis becomes terminal.40
The decision to exit should be triggered when:
Repositioning Cost > Valuation Upside: If the $100/SF required to modernize an asset does not result in a corresponding 15%+ yield on capital.30
The "Lost Prospect" Feedback is Universal: If every potential tenant indicates that the building's infrastructure (e.g., HVAC, power, light) is a non-starter.21
Financing is Non-Existent: If major lenders refuse to underwrite the asset because it lacks a net-zero pathway.44
In these cases, the manager must "stop" trying to sell their way out of trouble and instead "rearrange the deck chairs"—which may involve a distressed sale to an opportunistic investor who can take the long-term risk of a complete demolition and rebuild.6
Conclusion: The Strategic Imperative of Fit

August Berres Agile Workplace furniture enables clean floorplates. Clean floorplates enable quick occupancy.
The current crisis in the commercial real estate sector is not merely a byproduct of a remote-work trend; it is a fundamental reconfiguration of the relationship between occupiers and the built environment. As the Strategyzer framework demonstrates, low occupancy and reduced lease rates indicate that traditional office spaces no longer meet modern tenants' needs.4
Asset managers who treat their buildings as evolving service platforms rather than static rent-bearing shells are the ones capturing the "flight to quality." By benchmarking transition times—from the 3.4-month velocity of spec suites to the 24-month slog of obsolete shell space—managers can gain a realistic view of their asset's marketability.19 Finally, by establishing a clear "50/1" threshold for stranded assets and respecting the hard stops of environmental legislation, managers can protect their portfolios from the terminal decay of functional obsolescence.16 In the 2026 cycle, product-market fit is the only line between institutional relevance and permanent stranding.
Works cited
Achieve Product-Market Fit with our Brand-New Value Proposition ..., accessed March 5, 2026, https://www.strategyzer.com/library/achieve-product-market-fit-with-our-brand-new-value-proposition-designer-canvas
Value Proposition Canvas: Essential Guide for Product-Market Fit - Kaizenko, accessed March 5, 2026, https://www.kaizenko.com/value-proposition-canvas-essential-guide-for-product-market-fit/
Value proposition: win customers & drive business growth - Strategyzer, accessed March 5, 2026, https://www.strategyzer.com/value-proposition
The Product–Market Fit Crisis In Commercial Real Estate: Why The ..., accessed March 5, 2026, https://allwork.space/2025/09/the-product-market-fit-crisis-in-commercial-real-estate-why-the-cost-of-mismatched-portfolios-is-staggering-for-landlords-and-tenants/
Class A Office Leasing in 2025: Why Some Assets Won—and Others Fell Behind, accessed March 5, 2026, https://www.realtyads.com/class-a-office-leasing-in-2025-why-some-assets-won-and-others-fell-behind/
Office Recovery Signals Shift In Leasing And Demand - CRE Daily, accessed March 5, 2026, https://www.credaily.com/briefs/office-recovery-signals-shift-in-leasing-and-demand/
Value Proposition Design: Book Summary and Key Takeaways - Strategyzer, accessed March 5, 2026, https://www.strategyzer.com/library/value-proposition-design-book-summary
Value Proposition Canvas – Download the Official Template - Strategyzer, accessed March 5, 2026, https://www.strategyzer.com/library/the-value-proposition-canvas
Proving Product-Market Fit with 7 Hard Metrics, Not Opinions - ITONICS, accessed March 5, 2026, https://www.itonics-innovation.com/blog/product-market-fit
The Office Market 2025: Turning the Corner | NAIOP | Commercial Real Estate Development Association, accessed March 5, 2026, https://www.naiop.org/research-and-publications/magazine/2025/spring-2025/development-ownership/the-office-market-2025-turning-the-corner/
The 2026 Office Market Outlook: Navigating the New Normal - Crexi, accessed March 5, 2026, https://www.crexi.com/blog/2026-office-market-outlook
Office Space Market Size, Share, Trends, 2031 Report, accessed March 5, 2026, https://www.mordorintelligence.com/industry-reports/global-office-space-market
San Francisco's Office Turnaround: Led by Class A Assets, Accelerated by Policy - KBS, accessed March 5, 2026, https://kbs.com/insights/san-francisco-office-market-2025-a-prime-led-policy-assisted-turn/
Commercial real estate's comeback strategy by rebuilding the tenant ..., accessed March 5, 2026, https://www.abm.com/perspectives/cre-comeback-strategy-rebuilding-the-tenant-experience
Five Office Sector Metrics to Watch - Office of Financial Research (OFR), accessed March 5, 2026, https://www.financialresearch.gov/the-ofr-blog/2023/06/01/five-office-sector-metrics-to-watch/
Overcoming the stranded assets challenge | Willmott Dixon, accessed March 5, 2026, https://www.willmottdixon.co.uk/blog/overcoming-the-stranded-assets-challenge
Applied Masterclass: Value Proposition That Wins in the Market - Strategyzer, accessed March 5, 2026, https://www.strategyzer.com/training-events/applied-masterclass-value-proposition
Addressing stranded asset risk in real estate investment - GRESB, accessed March 5, 2026, https://www.gresb.com/addressing-stranded-asset-risk-in-real-estate-investment/
THE RISE OF SPEC SUITES: - Imgix, accessed March 5, 2026, https://nmrk.imgix.net/uploads/documents/The_Rise_of_Spec_Suites.pdf
CRE Metrics to Watch: Sector, Market, Asset - Green Street, accessed March 5, 2026, https://www.greenstreet.com/cre-metrics-to-watch-sector-market-asset/
Falling Out Of Product-Market Fit: Signs, Solutions And Opportunities - Forbes, accessed March 5, 2026, https://www.forbes.com/councils/forbestechcouncil/2024/08/30/falling-out-of-product-market-fit-the-signs-solutions-and-opportunities/
Assess Product-Market Fit Framework: Key Metrics & Validation Guide - Qubit Capital, accessed March 5, 2026, https://qubit.capital/blog/assess-product-market-fit
July 2025 Commercial Real Estate Market Insights - NAR.realtor, accessed March 5, 2026, https://www.nar.realtor/research-and-statistics/research-reports/july-2025-commercial-real-estate-market-insights
Ultimate Guide to CRE Market Benchmarking - CoreCast Blog, accessed March 5, 2026, https://blog.corecastre.com/corecast-blog/ultimate-guide-to-cre-market-benchmarking
BANKING ON CLIMATE: - NYCEDC, accessed March 5, 2026, https://edc.nyc/sites/default/files/2024-12/NYCEDC-Banking-on-Climate-Mortgage-Lending-for-Decarbonization.pdf
How multifamily operators can protect effective rent in competitive markets - Paylode, accessed March 5, 2026, https://paylode.com/articles/protect-effective-rent-multifamily-strategy
Premier AI for Yardi & RealPage Integration & Scale - Funnel Leasing, accessed March 5, 2026, https://funnelleasing.com/top-ai-leasing-software-integrating-with-yardi-and-realpage/
How to tell you are losing product market fit (and how to get it back) - Maddyness UK, accessed March 5, 2026, https://www.maddyness.com/uk/2024/09/30/how-to-tell-you-are-losing-product-market-fit-and-how-to-get-it-back/
AI in Commercial Real Estate - Scouts by Yutori, accessed March 5, 2026, https://scouts.yutori.com/342eec9c-8d2a-4599-85bc-4f9602357c0b
7 Commercial Property Leasing KPIs: Breakeven in 21 Months; - Financial Models Lab, accessed March 5, 2026, https://financialmodelslab.com/blogs/kpi-metrics/commercial-property-leasing
Commercial | Winter 2025 - Texas Real Estate Research Center, accessed March 5, 2026, https://trerc.tamu.edu/article/commercial-roundup/
Industrial Real Estate: Short-term Uncertainty, Long-term Confidence - Clarion Partners, accessed March 5, 2026, https://www.clarionpartners.com/insights/industrial-real-estate-outlook
Alexandria guides FFO/sh range, eyes $1.0B dispositions & 2026 spend - Stock Titan, accessed March 5, 2026, https://www.stocktitan.net/sec-filings/ARE/8-k-alexandria-real-estate-equities-inc-reports-material-event-bbf2179e2cb8.html
Navigating sustainable retrofit in real estate | Barclays Corporate Banking, accessed March 5, 2026, https://www.barclayscorporate.com/content/dam/barclayscorporate-com/documents/insights/Industry-expertise-24/Navigating-Sustainable-Retrofit-in-Real-Estate.pdf
Selling Commercial Real Estate in Anchorage: What to Expect in the Current 2025 Market, accessed March 5, 2026, https://www.commercialpropertiesak.com/blog/selling-commercial-real-estate-in-anchorage-what-to-expect-in-the-current-2025-market/
Current State of the U.S. Industrial Real Estate Market – Q3 2025, accessed March 5, 2026, https://www.mmcginvest.com/post/current-state-of-the-u-s-industrial-real-estate-market-q3-2025
ASSESSMENTS 2021 - Concord, NH, accessed March 5, 2026, https://www.concordnh.gov/DocumentCenter/View/18198/2021-Assessing-Presentation-to-City-Council
Research & Market Insights - Matthews, accessed March 5, 2026, https://www.matthews.com/insights?search=Denver
Climate risks and stranded assets: Protecting your property portfolio | TLT LLP, accessed March 5, 2026, https://www.tlt.com/insights-and-events/insight/climate-risks-and-stranded-assets-protecting-your-property-portfolio
What are stranded assets? | The Corporate Governance Institute, accessed March 5, 2026, https://www.thecorporategovernanceinstitute.com/insights/lexicon/what-are-stranded-assets-and-why-are-they-important/
Stranded Assets Repositioning Investments - NJEDA, accessed March 5, 2026, https://www.njeda.gov/stranded-assets-repositioning-investments/
Current Valuation Report Reveals Where CRE Values Declined in 3Q 2022 | SitusAMC, accessed March 5, 2026, https://www.situsamc.com/resources-insights/articles/current-valuation-report-reveals-where-cre-values-declined-3q-2022
Product > Strategy > Business Model - AVC, accessed March 5, 2026, https://avc.com/2013/06/product-strategy-business-model/
Emerging trends in real estate 2025 - PwC, accessed March 5, 2026, https://www.pwc.com/gx/en/investment-management-real-estate/assets/emerging-trends-report-2025.pdf