

Shifting Spaces: Understanding the Transformation of the U.S. Commercial Office Market
(Q1 2025 Report)
By Robert Kroon
I. Executive Summary

The outlook for increasing occupancy in commercial office space in most cities in the US is gloomy at best-unless owners take a proactive approach.
Analysis of recent commercial real estate market reports indicates that the total commercial office space in the United States is estimated to be approximately 4.8 billion square feet as of the first quarter of 2025.[1] This figure reflects the culmination of years of development, but the market is undergoing significant shifts. Key trends impacting the sector include elevated vacancy rates, fluctuating net absorption, a deceleration in new construction, and increasing office space conversions to alternative uses. While leasing activity has shown signs of recovery in some segments, the overall outlook suggests a period of stabilization and transformation for the U.S. commercial office space market.
II. Introduction: Understanding the US Commercial Office Market
Quantifying the total amount of commercial office space in the United States is crucial for a comprehensive understanding of the real estate market. This data serves as a fundamental benchmark for market analysts, investors, and businesses in their strategic planning and decision-making processes. It provides essential context for evaluating market health, identifying opportunities, and forecasting future trends.
However, obtaining a precise, universally accepted figure for the total inventory presents inherent challenges. Variations in definitions of "commercial office space," differences in data collection methodologies employed by various reporting agencies, and the continuous evolution of the real estate landscape contribute to these complexities. Furthermore, recent global events, most notably the widespread adoption of remote and hybrid work models, have significantly impacted the demand for traditional office space, analyzing total inventory and its utilization more critical than ever.
III. Analyzing Market Data and Trends: Indicators of the Current State
The current state of the U.S. commercial office market can be assessed through several key indicators, including vacancy rates, net absorption, and leasing activity.
Unoccupied and staying unoccupied.
Vacancy Rates: The proportion of unoccupied office space provides a direct measure of market health and the balance between supply and demand. Reports from various commercial real estate firms indicate a notable increase in national vacancy rates in recent years. Towards the end of 2023, the national vacancy rate was 19.7%.[2] This upward trend continued into 2024, with rates reaching 20.1% in the first half of the year [3] and 19.4% by November.[4]
More recent data from the first quarter of 2025 indicates a total vacancy rate of 22.6% [1] and an overall availability rate of 23.3%.[6] This progression signifies a substantial amount of office space currently available across the country, reflecting shifts in occupancy patterns. Different reports, however, present slightly varying figures underscoring the importance of considering the specific reporting period and the methodologies employed by each source when interpreting vacancy data.
For instance, one report noted a "post-COVID high" vacancy rate of 17.5% in the first quarter of 2024 [7], while another indicated 20.8% at the end of a different quarter, likely the first of 2025 based on the report context.[8] This variation highlights the dynamic nature of the market and the sensitivity of these metrics to the specific timeframe under review. Moreover, vacancy rates are not uniform across the nation. For example, in the fourth quarter of 2023, South Florida exhibited the lowest metro vacancy rate outside of tertiary markets at 9.92%, while Austin had the highest at 22.7%.[9] Such regional disparities suggest that the national figure masks significant local market conditions and potentially varying amounts of office space available in different metropolitan areas.
Net Absorption: This metric measures the change in occupied office inventory over a specific period. Negative net absorption indicates a decrease in occupied space, while positive net absorption signifies an increase. Throughout 2023, the U.S. office market experienced negative net absorption, with one report citing a decline of over 68 million square feet for the year.[9] Forecasts from early 2023 anticipated this trend to continue [10], and indeed, the fourth quarter alone saw a negative absorption of 16.9 million square feet.
However, more recent data suggests a potential shift. The second and third quarters of 2024 saw positive net absorption [11], and the fourth quarter of 2024 marked the first quarter of positive net absorption since the end of 2021.[12] Looking into 2025, while the first quarter still registered negative net absorption [1], it represented a considerable improvement compared to the same period in the previous year.[1]
This suggests that while the overall trend since the pandemic's onset points to a reduction in occupied office space, there are emerging signs of stabilization and a potential recovery in demand in more recent periods. The cumulative effect of negative absorption over the past few years implies that the total amount of office space might currently exceed the immediate demand.
Leasing Activity: The volume of office space leased provides insights into the level of tenant demand and market dynamism. Notably, leasing activity established post-pandemic highs for three consecutive quarters leading into the end of 2024.[12] In the fourth quarter of 2024, the volume reflected over 92% of pre-pandemic averages.[12] This momentum continued into the first quarter of 2025, with total leasing activity reaching 66.4 million square feet [6], marking a significant increase compared to the first quarter of 2024.[1]
Expectations from industry professionals also point towards improved leasing activity soon.[13] However, a nuanced perspective reveals that while the number of lease signings might be up, occupiers are taking less space on average and increasingly favoring renewals over relocations.[18] This trend suggests that even with increased leasing activity, the demand for the existing total inventory might still be lower than pre-pandemic levels, as companies optimize their space needs in response to evolving work patterns.
Furthermore, a discernible preference for "prime" or Class A buildings in leasing activity is evident.[17] This indicates a divergence within the market, where newer, higher-quality office spaces attract significant tenant interest, while older or less desirable buildings contribute more substantially to the overall vacancy. This bifurcation in demand highlights the quality distribution within the total inventory of office space.
IV. Supply-Side Dynamics: Construction and New Deliveries
The supply side of the commercial office market, particularly the construction pipeline and the delivery of new space, plays a crucial role in shaping the total inventory.
Construction Pipeline: The amount of office space currently under construction indicates future supply trends. Across multiple reports and timeframes, a consistent pattern of a shrinking construction pipeline emerges.[2] In March 2023, the national office stock under construction was reported at 123.5 million square feet.25 By the fourth quarter of 2023, this figure had decreased to 72.1 million square feet [9], then declined to 48.6 million square feet by February.[26]
More recent data from the first quarter of 2025 shows the pipeline at 31 million square feet, [1], and even lower at 26.2 million square feet in another report.[8] This consistent reduction in the construction pipeline signifies a significant slowdown in the growth of the total commercial office space inventory. This cautious approach by developers likely reflects the decreased demand and higher vacancy rates observed in the market.
New Deliveries: The amount of new office space completed and delivered to the market directly impacts the total inventory. In 2023, over 39 million square feet of new projects were delivered [9], with 5.4 million square feet completed in the fourth quarter alone.9 However, the pace of deliveries has since slowed considerably.
In the first quarter of 2025, only 3.5 million square feet of new product was delivered, [1], representing the lowest quarterly total in over a decade.[1] For 2024, office deliveries hit a 10-year low [26], and projections indicate an even smaller total for 2025.[17] The diminishing volume of new office space added to the market reinforces the slowdown in supply growth, suggesting that the existing total inventory is not significantly augmented by new construction.
V. Inventory Adjustments: The Role of Conversions and Demolitions in Shaping the Total Office Space
Beyond new construction, the total stock of commercial office space is also influenced by the removal of existing inventory through conversions to other uses and demolitions.
Conversions: An increasingly prominent trend in the commercial real estate market is the conversion of office buildings to alternative uses, such as residential apartments, life sciences facilities, or hotels.[12] This adaptive reuse strategy is gaining traction as a response to changing demand for office space and the relative strength of other sectors, particularly the multifamily residential market.[29]
By the third quarter of 2024, 71 million square feet of U.S. office inventory was either planned for or already undergoing conversion.[24] The number of conversion projects completed or scheduled for delivery in 2024 was the highest since tracking began in 2016.[27] Office-to-multifamily conversions account for the majority of these projects [27], with a significant number of residential units being added to the supply through this process.[27] This growing trend of office building conversions directly reduces the total stock of commercial office space, representing a significant adjustment to the overall inventory.
Demolitions: While data on office building demolitions is not as readily available in the provided snippets, it is another factor that contributes to the adjustment of the total commercial office space inventory. Older, obsolete buildings in less desirable locations may be demolished to make way for new developments or other land uses. The combined effect of conversions and demolitions leads to a net decrease in the total amount of commercial office space available, partially offsetting any new construction and playing a crucial role in shaping the overall market size.
VI. Estimating the Total Amount of Commercial Office Space in the US

All things considered, there is about 4.8 billion square feet of office space in the US.
Based on the analysis of available market reports, we can derive an estimate for the total amount of commercial office space in the United States.
Direct Inventory Figures: A report from JLL in the first quarter of 2025 directly states that the total existing office inventory in the United States is 4.8 billion square feet.[1] This figure appears to be the most comprehensive and recent estimate explicitly provided within the research material. While another source mentioned 4.4 billion square feet of occupied office space [30], this represents the utilized portion of the inventory and thus serves as a lower bound for the total.
Indirect Estimates and Calculations: While a direct total inventory figure from CBRE is not present in these snippets, their data on GSA-leased space offers an avenue for an indirect estimate.
CBRE reports that the General Services Administration (GSA) leases about 1.7% of the total U.S. office inventory within the 58 markets they track.[31] This leased space amounts to 69 million square feet.[31] Based on this, the total office inventory tracked by CBRE can be estimated to be approximately 4.06 billion square feet (69 million / 0.017). The slightly lower figure compared to JLL's 4.8 billion square feet could be attributed to differences in the scope of buildings tracked. CBRE's statistics focus on buildings of 10,000 square feet or more and exclude owner-occupied buildings.[31]
Reconciling Different Data Points: It is important to acknowledge that variations in methodology, definitions of commercial office space, and the specific scope of buildings included in the data collection can lead to discrepancies between different sources. However, considering the direct statement from JLL, which provides a comprehensive figure for the total existing inventory as of the first quarter of 2025, the estimated total amount of commercial office space in the US is approximately 4.8 billion square feet.
VII. Regional Market Overview
While the national figures provide a broad overview, significant variations exist across different regional markets in the United States. Several snippets highlight specific market conditions that offer a more nuanced understanding of the total inventory and its utilization.
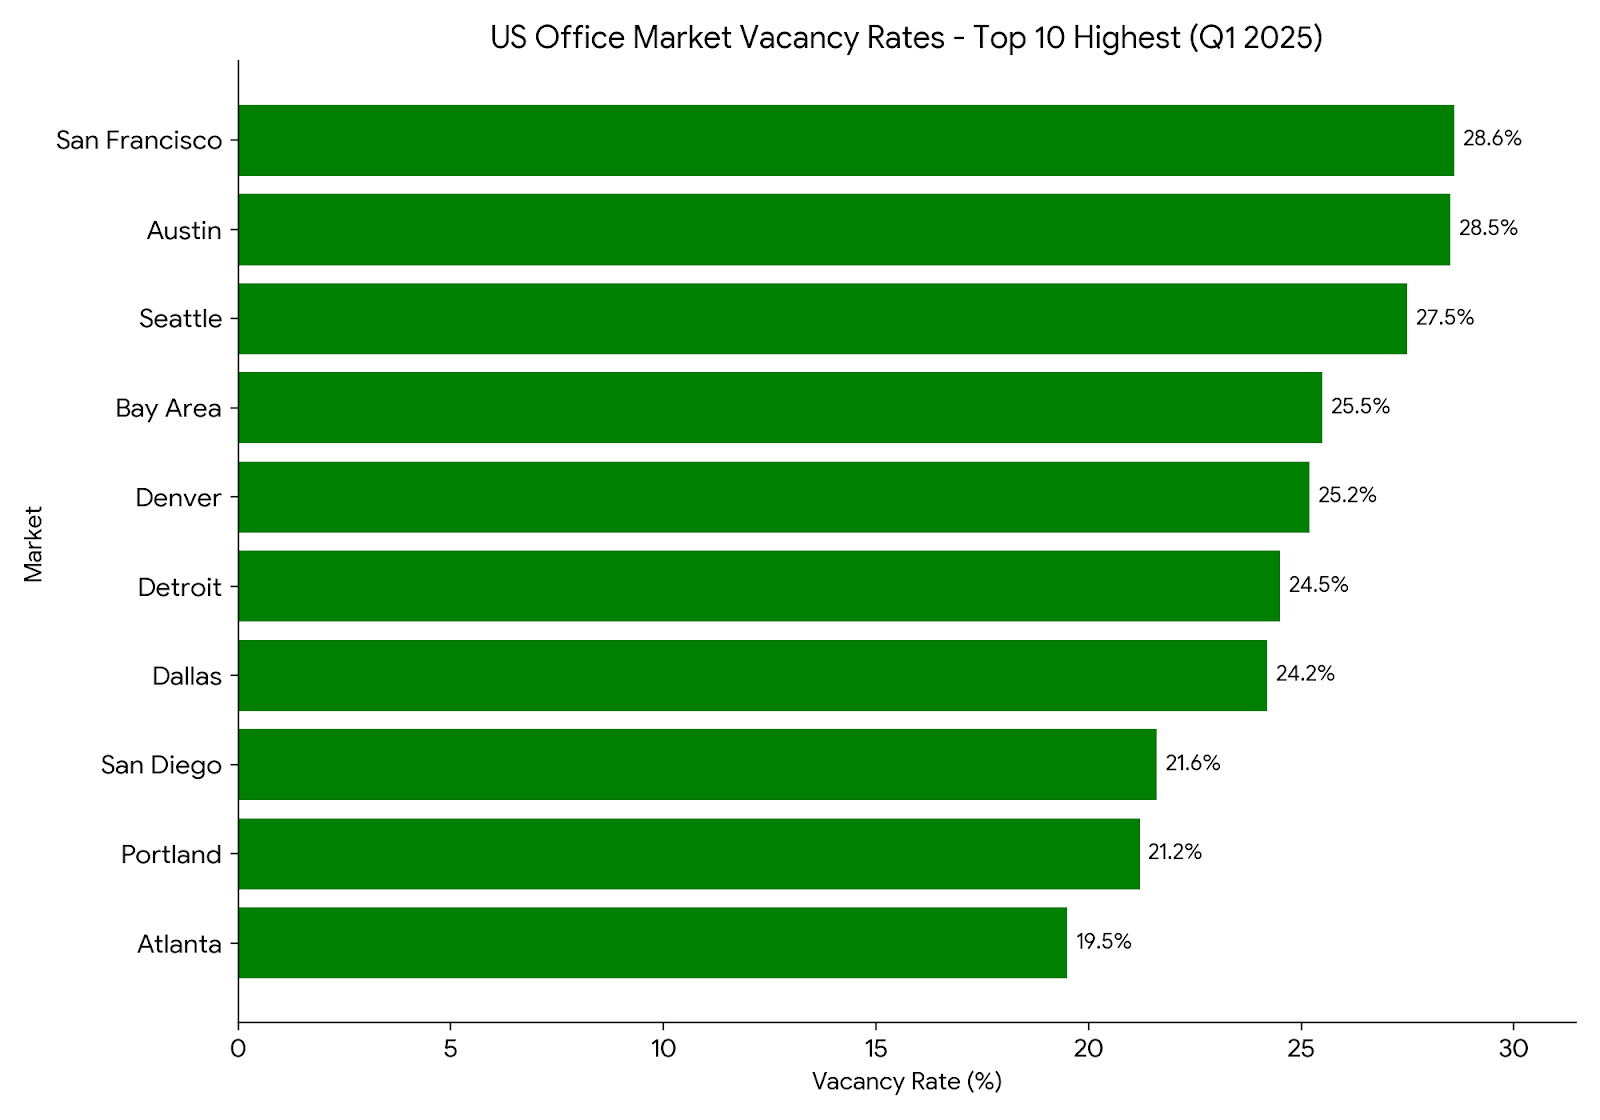
Tech-heavy markets such as Austin, the Bay Area, Denver, San Francisco, and Seattle have consistently reported high vacancy rates [4], indicating a greater supply of available office space in these areas. In contrast, markets like South Florida, Las Vegas, and Jacksonville have shown lower vacancy rates [9], suggesting tighter supply and potentially higher occupancy.
Manhattan stands out with strong leasing activity [6], indicating sustained demand in this major urban center. Cleveland has emerged as a leading market for office space conversions [27], suggesting a significant adjustment of the office inventory in that region. Furthermore, federal lease terminations are expected to have a notable impact on the office market in Washington D.C..[1] These regional differences underscore that the total inventory and its utilization are not uniform across the United States, with varying market dynamics influencing the landscape in different metropolitan areas.
VIII. Conclusion
Based on the analysis of recent commercial real estate market reports, the estimated total amount of commercial office space in the United States is approximately 4.8 billion square feet as of the first quarter of 2025.1 The market is currently characterized by elevated vacancy rates, although recent data suggests a potential stabilization in demand. The construction pipeline has significantly contracted, indicating a slowdown in the growth of new supply. Simultaneously, a growing trend of office space conversions to other uses is actively reducing the existing inventory. While leasing activity has shown signs of recovery in certain segments and markets, the overall landscape of U.S. commercial office space is undergoing a period of significant transformation, influenced by evolving work patterns and economic conditions.
Works cited
www.jll.com, accessed May 3, 2025, https://www.jll.com/content/dam/jllcom/en/global/documents/reports/research-reports/25-research-us-office-market-dynamics-q1-2025.pdf
MARKETBEAT - US NATIONAL - Office Q4 2023 - Cushman & Wakefield, accessed May 3, 2025, https://assets.cushmanwakefield.com/-/media/cw/marketbeat-pdfs/2023/q4/us-reports/office/us_office_marketbeat_q4-2023.pdf?rev=1c7acb477abe4e89b557c770f643bd10
US vacancy rate of commercial buildings sits at nearly 40-year high - Moody's, accessed May 3, 2025, https://www.moodys.com/web/en/us/about/insights/data-stories/us-commercial-real-estate-vacancies-downtown-vs-suburbs.html
Lower Sale Prices and Reduced Development Signal Continued Stress in the Office Sector - CommercialEdge, accessed May 3, 2025, https://www.commercialedge.com/blog/national-office-report-december-2024/
U.S. Office Rents Report April 2025 - CommercialEdge, accessed May 3, 2025, https://www.commercialedge.com/blog/national-office-report/
Q1 2025 US office market overview - Avison Young, accessed May 3, 2025, https://www.avisonyoung.us/us-office-market-overview
Chart: How Many U.S. Offices Are Empty? | Statista, accessed May 3, 2025, https://www.statista.com/chart/32590/vacancies-in-the-us-office-real-estate-sector-by-quarter-in-percent/
U.S. Office MarketBeat Reports - Cushman & Wakefield, accessed May 3, 2025, https://www.cushmanwakefield.com/en/united-states/insights/us-marketbeats/us-office-marketbeat-reports
U.S. Office Market Report | Q4 2023 | Coy Davidson - The Tenant Advisor, accessed May 3, 2025, https://coydavidson.com/u-s-office-market-report-q4-2023/
Office Space Demand Forecast, Second Quarter 2023 - NAIOP, accessed May 3, 2025, https://www.naiop.org/research-and-publications/research-reports/reports/office-space-demand-forecast-2q23/
Office Space Demand Forecast, Fourth Quarter 2024 | NAIOP, accessed May 3, 2025, https://www.naiop.org/research-and-publications/research-reports/reports/office-space-demand-forecast-4q24/
U.S. Office Market Dynamics, Q4 2024 - JLL, accessed May 3, 2025, https://www.jll.com/en-us/insights/market-dynamics/office-market-statistics-trends-office
The Office Market 2025: Turning the Corner | NAIOP | Commercial Real Estate Development Association, accessed May 3, 2025, https://www.naiop.org/research-and-publications/magazine/2025/spring-2025/development-ownership/the-office-market-2025-turning-the-corner/
U.S. Office Market Dynamics, Q4 2024 - JLL, accessed May 3, 2025, https://www.us.jll.com/en/trends-and-insights/research/office-market-statistics-trends
U.S. Office Market Dynamics, Q1 2025 - JLL, accessed May 3, 2025, https://www.jll.com/en-us/insights/us-office-market-dynamics.html
U.S. Office Market Dynamics, Q1 2025 - JLL, accessed May 3, 2025, https://www.jll.com/en-us/insights/us-office-market-dynamics
U.S. Real Estate Market Outlook 2025 - Office/Occupier, accessed May 3, 2025, https://www.cbre.com/insights/books/us-real-estate-market-outlook-2025/office-occupier
U.S. Sees Uptick in Office Lease Signings, But for Less Space on Average | CBRE, accessed May 3, 2025, https://www.cbre.com/insights/briefs/us-sees-uptick-in-office-lease-signings-but-for-less-space-on-average
2024's Top 100 Office Leases: Occupiers Take More Space on Average | CBRE, accessed May 3, 2025, https://www.cbre.com/insights/briefs/2024s-top-100-office-leases-occupiers-take-more-space-on-average
United States Office Market Overview | Newmark, accessed May 3, 2025, https://www.nmrk.com/insights/market-report/united-states-office-market-overview
The Bright Side of Office: Growth Opportunities in the Urban Core - Cushman & Wakefield, accessed May 3, 2025, https://www.cushmanwakefield.com/en/united-states/insights/the-bright-side-of-office
New York City Office Market Reports | Avison Young US, accessed May 3, 2025, https://www.avisonyoung.us/web/new-york/office-market-report
The Misunderstood U.S. Office Market - Brookfield, accessed May 3, 2025, https://www.brookfield.com/news-insights/insights/misunderstood-us-office-market
10 Signs of U.S. Office Market Stabilization - CBRE, accessed May 3, 2025, https://www.cbre.com/insights/briefs/10-signs-of-us-office-market-stabilization
National Office Report - CommercialEdge, accessed May 3, 2025, https://www.commercialedge.com/wp-content/uploads/sites/75/2023/03/CommercialEdge-Office-National-Report-March-2023.pdf
U.S. Office Market Outlook – March 2025 - Yardi Matrix, accessed May 3, 2025, https://www.yardimatrix.com/blog/us-office-market-outlook/
Strong Office Conversion Pipeline Will Boost Business-Centric Downtowns - CBRE, accessed May 3, 2025, https://www.cbre.com/insights/briefs/strong-office-conversion-pipeline-will-boost-business-centric-downtowns
US office conversion projects could be up 63% this year: CBRE | Facilities Dive, accessed May 3, 2025, https://www.facilitiesdive.com/news/us-office-conversion-projects-could-be-up-63-this-year-cbre/733901/
JLL Reports Historic Dip in Office Space Inventory Across the U.S, accessed May 3, 2025, https://allwork.space/2024/05/jll-reports-historic-dip-in-office-space-inventory-across-the-u-s/
OFFICE, accessed May 3, 2025, https://www.afire.org/wp-content/uploads/2024/08/Summit-15-%E2%80%93-Cushman-Wakefield-%E2%80%93-Article.pdf
Reduction in Federal Space to Have Minimal Impact on Emerging ..., accessed May 3, 2025, https://www.cbre.com/insights/briefs/reduction-in-federal-space-to-have-minimal-impact-on-emerging-us-office-market-recovery