

The Compounding Costs of Antiquated Office Power Infrastructure
An Analysis of Financial Impacts
By Robert Kroon
Executive Summary: The Compounding Costs of Antiquated Office Power Infrastructure
Modern commercial buildings face significant, yet often underestimated, financial burdens stemming from inflexible and inefficient traditional Alternating Current (AC) power infrastructure. This report quantifies these costs, revealing substantial drains related to underutilized real estate, excessive energy consumption, disruptive and expensive reconfigurations, and tangible safety hazards. The analysis demonstrates that outdated power systems impose direct operational costs and hinder the agility required in today's dynamic business environment.

This report quantifies these costs, revealing substantial drains related to underutilized real estate, excessive energy consumption, disruptive and expensive reconfigurations, and tangible safety hazards.
Key findings indicate considerable annual costs associated with wasted office space driven by power infrastructure inflexibility, significant energy waste due to inherent inefficiencies in AC-to-Direct Current (DC) conversion and parasitic plug loads, and substantial financial impacts from office reconfigurations amplified by fixed power systems.
Furthermore, the reliance on extension cords and resulting cable clutter creates quantifiable safety risks, contributing to costly workplace accidents. These individual cost factors do not exist in isolation; they compound, creating a substantial barrier to operational efficiency, financial health, and organizational adaptability.
Modernizing power infrastructure transcends a simple upgrade; it represents a strategic imperative for organizations aiming to optimize resource allocation, reduce operating expenditures, enhance workplace safety, and unlock the flexibility needed to thrive. This report provides a data-driven foundation for understanding the quantifiable problems posed by legacy AC power systems in commercial offices.
I. The High Price of Inflexibility: Quantifying Wasted Commercial Office Space
A. Context: The Underutilized Office Landscape
The U.S. commercial office market is currently navigating a period of significant adjustment. Post-pandemic shifts in work patterns have led to historically high vacancy rates, with national averages reaching 19.8% at the end of 2024 and 19.9% by March 2025 . Earlier projections indicated rates could reach 21% for 2024 and 23% for 2025. This reflects a fundamental change in demand, which has stabilized at approximately 30% below pre-pandemic levels.
However, market vacancy rates only tell part of the story. Within occupied office spaces, a significant utilization gap persists. Research indicates that, on average, only 39% of office space is actively utilized on a typical day. This implies that nearly two-thirds of leased and paid-for square footage often sits empty or underused, representing a substantial financial inefficiency. Studies have documented specific instances of this phenomenon, such as large meeting rooms designed for over 20 people being consistently used by only one individual. The confluence of high market vacancy and low internal utilization points to a vast reservoir of expensive, unproductive commercial real estate. Organizations are frequently locked into leases, paying premium rates for space that fails to actively contribute to productivity or revenue generation.
B. Linking Inflexible Power to Underutilization

Floor receptacles can be very difficult to move, especially if a new office layout requires the floor to be cored to create new wire pathways.
Traditional AC power infrastructure, characterized by fixed electrical outlets embedded in walls or floor monuments, inherently restricts office layout flexibility. This rigidity clashes with the modern workplace's demand for adaptable environments supporting diverse work modes, including focus work, in-person collaboration, and virtual meetings, often required by hybrid schedules . While employees might desire flexibility in theory, they rarely reconfigure fixed elements once settled, underscoring the importance of an initial setup that facilitates optimal space use, something hindered by fixed power .
The fixed nature of power outlets makes adapting office layouts costly and time-consuming when responding to evolving team sizes, technological requirements, or shifts towards hybrid work models. This difficulty in adaptation prevents organizations from optimizing their space for current operational needs, directly contributing to the significant utilization gap previously identified. Hybrid work policies, which often allow for greater employee flexibility, can highlight areas of underutilization, but realizing potential space savings requires the physical ability to adapt the layout – a process impeded by fixed power.
While isolating the precise contribution of power infrastructure to space underutilization is challenging, its role as a constraint on layout optimization is undeniable. Fixed power outlets dictate where desks and equipment can be placed, preventing the fluid rearrangement needed to match space allocation with actual usage patterns . Based on the established link between layout needs and power constraints, it is reasonable to estimate that power infrastructure inflexibility contributes significantly to the overall cost of underutilized space. A conservative analyst estimate places this contribution at approximately 5-10% of the total cost associated with the ~61% of underutilized office space.
Calculating the financial impact involves applying this understanding to current market rates.
Calculation - Cost of Wasted Space:
Average US office lease rates stood at $33.11 per square foot overall and $39.56 per square foot for Class A properties as of December 2024.
Applying the average underutilization rate of 61% (derived from 39% utilization ) yields the cost of generally underutilized space.
Multiplying this by an estimated 7.5% (midpoint of the 5-10% range) attributable to power inflexibility quantifies the specific cost component.
Formula: (Avg. Lease Rate/sq ft) * (61% Underutilization) * (7.5% Attributable to Power Inflexibility) = Estimated Annual Cost of Wasted Space per sq ft due to Power Inflexibility.
This calculation reveals an estimated annual cost of $1.51 per square foot for average office space and $1.81 per square foot for Class A space, directly attributable to the layout limitations imposed by inflexible power infrastructure.
The rise of hybrid work models further exacerbates this issue. Organizations increasingly seek less overall space but require the remaining footprint to be more adaptable. Inflexible power infrastructure prevents efficient rightsizing and reconfiguration of the retained space. Consequently, companies may hold onto larger, poorly utilized areas simply because the cost and disruption of adapting the power system are prohibitive. This leads to amplified financial waste per occupied square foot compared to a scenario where the power infrastructure supports easy adaptation.
C. The Financial Burden of Reconfiguration (Churn Costs)
Office environments are dynamic; layouts frequently require modification ("churn") to accommodate evolving business strategies, team reorganizations, technology upgrades, or changing work patterns like those adopted post-pandemic . Reconfiguring spaces with traditional, fixed AC power infrastructure incurs significant direct and indirect costs.
Direct electrical reconfiguration involves moving or adding outlets and associated wiring. This necessitates skilled labor, with electricians charging between $50 and $130 per hour, and potentially more for highly experienced professionals . The cost to move a single outlet typically ranges from $40 to $250 , while installing a new one can cost $130 to $352 . Complex reconfigurations may require new wiring runs ($100-$1,000+ ) and subsequent repairs to walls or floors ($300-$900 for drywall ). Overall commercial electrical wiring costs average between $6-$12 per square foot for office spaces , sometimes representing 4-10% of a total renovation project's budget .
However, the most significant cost associated with reconfiguration driven by inflexible power is often the indirect cost of operational disruption and lost productivity. Electrical work, particularly involving fixed infrastructure, can necessitate shutting down sections of the office, rendering employees unable to perform their tasks . This downtime translates directly into financial losses. While specific data for office renovation downtime is scarce, IT system downtime costs serve as a relevant proxy, highlighting the magnitude of productivity loss. Estimates place the average cost of IT downtime at $5,600 per minute (Gartner, 2014) , with later studies suggesting figures closer to $9,000 per minute (Ponemon, 2016) . Even for smaller businesses, costs range from $137-$427 per minute , while large enterprises can face hourly costs exceeding $1 million . Productivity loss can be estimated by multiplying the number of affected employees by the duration of the downtime and their average wage or contribution to revenue .
The substantial cost of this disruption often dwarfs the direct expenses of materials and electrical labor. Systems requiring extensive rewiring and invasive work maximize this downtime. Therefore, the inflexibility of the power system directly inflates the true cost of adapting the workspace, potentially making necessary changes prohibitively expensive.
Calculation - Estimated Cost per Reconfiguration (Illustrative 5,000 sq ft):
Direct Electrical Costs: Assuming 50 outlets are moved/added at an average cost of $150 each, plus a $2,500 contingency for wiring complexity: $10,000.
Estimated Downtime: Assuming 3 days of disruption affecting 50 employees.
Estimated Productivity Loss: Based on 50 employees, 3 days downtime, and an estimated daily cost per employee of $240 (derived from average salaries): $36,000.
Total Estimated Cost Impact: $10,000 (Direct) + $36,000 (Productivity Loss) = $46,000.
This example illustrates how the indirect costs of disruption significantly contribute to the overall financial burden of reconfiguring space limited by fixed power infrastructure.
Table 1: Estimated Annual Cost of Wasted Office Space Due to Power Infrastructure Inflexibility (per 10,000 sq ft)
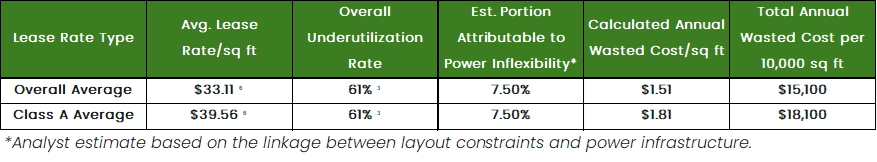
Table 1: Estimated Annual Cost of Wasted Office Space Due to Power Infrastructure Inflexibility (per 10,000 sq ft)
This table quantifies the ongoing operating expense bleed caused by the inability to optimize space utilization due to rigid power systems.

Table 2: Estimated Cost Impact of One Major Office Reconfiguration Cycle (Illustrative 5,000 sq ft)
This table demonstrates the significant financial hit associated with adapting a space constrained by fixed power, driven heavily by operational disruption.
II. The Silent Drain: Energy Losses and Excess Costs from Inefficient AC Power
A. The Multi-Stage Problem of AC Power Delivery
Traditional AC power infrastructure within commercial buildings presents multiple opportunities for energy loss, creating a cumulative drain on resources. While energy losses during grid-level transmission and distribution (T&D), estimated around 5-6%, are largely beyond the control of individual building operators, significant inefficiencies occur within the building itself. These internal losses arise from the building's electrical distribution wiring, the mandatory conversion of AC power to DC power for most modern devices, and the persistent energy draw of equipment in standby modes (parasitic loads). Each stage in this conventional AC power pathway contributes to inefficiency, and these losses compound, resulting in substantial energy waste that could be mitigated through modernized in-building power systems. Addressing the internal distribution and conversion stages offers a significant energy and cost savings opportunity.
B. Energy Loss in AC-to-DC Conversion

Given that approximately 51% of commercial building electrical loads are identified as native DC (including miscellaneous electronic loads like office equipment and lighting), applying the 14% average conversion loss to this segment provides a reasonable estimate of the energy wasted.
A fundamental inefficiency in standard AC-powered offices stems from the incompatibility between the building's power supply and the requirements of modern electronic equipment. Office devices—including computers, monitors, laptops, printers, and communication equipment—operate internally using DC power. However, building electrical systems deliver AC power. This necessitates an AC-to-DC conversion at nearly every endpoint device, typically handled by an external power supply (EPS), often called a "power brick," or an internal power supply unit (PSU) built into the device.
This conversion process is inherently lossy. Research from Lawrence Berkeley National Laboratory (LBNL) and the Department of Energy (DOE) indicates an average AC-to-DC conversion loss of 14% in commercial buildings. This figure represents a significant portion of energy wasted simply transforming power from the wall outlet to a usable form for the device.
It's important to note this is an average; the actual efficiency of power supplies varies widely. EPA estimates suggest that typical EPS units may only be 50-70% efficient, while surveys show marketed supplies ranging from 60% to over 85% efficiency.
Recognizing this inefficiency, programs like 80 PLUS certify power supplies meeting specific efficiency targets (e.g., 80 PLUS Bronze requires 82-85% efficiency at various loads for standard 115V internal PSUs, while higher tiers like Titanium reach 90-94%). However, even these certified supplies often operate less efficiently at the low load levels common during typical office computer use.
While some studies suggest high-quality DC/DC converters may not be inherently more efficient than high-quality AC/DC converters in specific appliance tests, the primary energy-saving opportunity arises from eliminating the multiple, redundant AC-to-DC conversions inherent in a traditional AC distribution system. Systems delivering DC power directly can bypass these individual conversion losses.
To estimate the cost of this conversion waste, one can consider the portion of building electricity consumed by devices requiring AC-to-DC conversion. Given that approximately 51% of commercial building electrical loads are identified as native DC (including miscellaneous electronic loads like office equipment and lighting), applying the 14% average conversion loss to this segment provides a reasonable estimate of the energy wasted.
C. Energy Loss in In-Building AC Distribution
Beyond conversion losses at the device level, the traditional AC electrical distribution network within the building itself contributes to energy waste. Electrical current flowing through copper wiring inherently encounters resistance, which dissipates energy as heat.
While precise quantification of these resistive losses in typical office building internal wiring is complex and not readily available from the provided sources, high-density environments like data centers report distribution system losses (including wiring and Power Distribution Units - PDUs) averaging 10-12%. This suggests that losses within the extensive wiring networks of commercial office buildings, while likely lower than in data centers, are non-negligible.
Furthermore, step-down transformers used within the building's electrical system to reduce voltage for different circuits also introduce energy losses, although these are not specifically quantified for offices in the research. The potential for reduced transmission losses is sometimes cited as a benefit of DC distribution systems, indirectly supporting the idea that AC distribution incurs higher losses. However, the focus for quantifiable savings remains primarily on conversion and plug load inefficiencies.
D. The Cost of Plug Load Inefficiencies (Parasitic/Vampire Loads)

GSA Proving Ground research indicates that strategies to manage plug loads can save $0.17 to $0.23 per square foot annually in a typical office setting.
A significant and often overlooked source of energy waste in offices is associated with plug loads – the energy consumed by any device plugged into an electrical outlet. These loads constitute a substantial portion of an office building's total energy consumption, averaging around 30% but potentially accounting for 47% or more when including process loads and refrigeration. In highly energy-efficient buildings where HVAC and lighting loads are minimized, plug loads can represent over 50% of the total energy use.
A critical component of plug load energy consumption is "parasitic" or "vampire" load – the power drawn by equipment turned off or in standby mode but still plugged in. This unproductive energy drain can account for up to 30% of total plug load energy. Common office culprits include computers, monitors, printers, copiers, and breakroom appliances like microwaves and coffee makers.
The financial impact of this waste is considerable. GSA Proving Ground research indicates that strategies to manage plug loads can save $0.17 to $0.23 per square foot annually in a typical office setting. Studies show that using advanced power strips (APS) with schedule timers can reduce plug load energy by an average of 48%, with savings reaching 27-69% for devices like printers. Enabling built-in power management features on computers can reduce energy use by over 60% during non-business hours.
The conventional fixed AC outlet infrastructure directly enables this parasitic waste. Standard outlets provide continuous power, and there is typically no centralized or convenient way to de-energize outlets when devices are not in use. Consequently, energy is constantly supplied to devices drawing power unproductively. In contrast, modern, flexible power systems often incorporate smart controls or allow for easier integration of management devices (like APS or PoE systems) that can actively monitor and curtail this unnecessary energy consumption.
E. Calculating Total Energy Waste Cost
To estimate the total annual cost of energy wasted by inefficient AC power infrastructure, we can combine the quantifiable losses from AC-to-DC conversion and parasitic plug loads. Using the average US commercial electricity rate of 12.85 cents per kWh (2024 figure) allows for conversion of energy waste into a dollar amount.
Calculation - Annual Energy Waste Cost:
Assume a baseline office electricity use of approximately 10.27 kWh/sq ft/year (derived from average cost of $1.32/sq ft/yr and rate of $0.1285/kWh ).
Assume plug loads account for 35% of this usage : 10.27 kWh/sq ft/yr * 0.35 = 3.59 kWh/sq ft/yr.
Conversion Waste: 3.59 kWh/sq ft/yr * 14% average loss = 0.50 kWh/sq ft/yr wasted. Cost = 0.50 kWh/sq ft/yr * $0.1285/kWh = $0.064/sq ft/yr.
Parasitic Waste: Use the GSA estimate of potential savings from managing plug loads as a proxy for waste: $0.20/sq ft/yr (midpoint of $0.17-$0.23 range ).
Total Estimated Waste Cost: $0.064/sq ft/yr (Conversion) + $0.20/sq ft/yr (Parasitic) = $0.264 per square foot per year.
This calculation suggests a tangible and ongoing operational cost directly linked to the inefficiencies inherent in traditional AC power delivery and endpoint conversion.
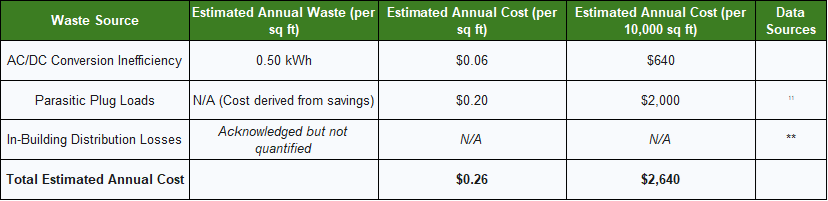
Table 3: Estimated Annual Energy Waste Costs from AC Power Infrastructure (per 10,000 sq ft)
This table isolates the key energy waste components attributable to standard AC power systems and translates them into an annual operating expense.
III. Beyond Direct Costs: The Wider Impact of Outdated Power Infrastructure
The financial penalties of antiquated AC power infrastructure extend beyond wasted space and energy consumption. These systems also introduce significant safety risks, hinder operational agility, and negatively affect the workplace environment.
A. Safety Hazards and Associated Costs
A direct consequence of inflexible power infrastructure, with its insufficient or inconveniently located fixed outlets, is the proliferation of extension cords and power strips, leading to tangled and trailing cables . This clutter creates significant trip-and-fall hazards, a major cause of workplace injuries.

Slips, trips, and falls make up 15% to over 30% of workplace accidents, varying by data source and industry.
Slips, trips, and falls are consistently among the leading causes of non-fatal workplace injuries. Statistics indicate they account for roughly 15% to over 30% of all workplace accidents, depending on the data source and industry focus.
The financial burden is substantial, with estimates suggesting these incidents cost the U.S. economy $70 billion annually in workers' compensation and medical expenses, or potentially $171 billion in total costs when considering broader economic impacts (NSC 2019).
Direct workers' compensation costs for disabling injuries exceed $1 billion per week. Falls on the same level, the type most associated with tripping over cords, cost employers nearly $10 billion annually. The cost per individual claim can be significant, averaging over $40,000 in some reports. While not all falls are caused by cables, the hazardous conditions created by inadequate fixed power outlets are a clear contributing factor.
Furthermore, outdated electrical infrastructure can pose fire risks. Overloaded circuits, often resulting from plugging too many devices into limited outlets via extension cords, and the potential for faulty or aging wiring in older systems, increase the likelihood of electrical fires.
Store and office fires alone result in approximately $932 million in property damage annually in the U.S.. The seemingly minor inconvenience of cable clutter translates directly into a statistically significant and financially burdensome safety risk. This hazard is a tangible consequence of a power infrastructure that lacks the flexibility to meet modern workplace needs safely and effectively.
B. Operational Disruptions and Reduced Agility
Inflexible power systems directly impede day-to-day operations and broader organizational agility. Insufficient or poorly located power outlets act as a constant drag on employee productivity . Time is wasted searching for available outlets, dealing with devices running out of power, or being unable to position equipment optimally for workflow. This friction reduces efficiency and can lead to employee frustration.
More strategically, the physical rigidity imposed by fixed power outlets limits an organization's ability to adapt its workspace quickly and cost-effectively. This inability to easily reconfigure office layouts hinders adaptation to shifting market demands, the launch of new projects, changes in team structures, or the adoption of new work models like hybrid work . As highlighted in the user's initial problem statement, breaking free from these infrastructure limitations is essential for achieving true organizational agility.
Additionally, while not solely caused by inflexibility, older power systems may be less resilient, increasing vulnerability to power disruptions. Even momentary interruptions can have severe consequences, impacting data integrity, halting critical operations, and incurring substantial costs, particularly for data-dependent businesses .
C. Negative Impact on Professionalism and Functionality
The visible manifestation of inadequate power infrastructure – tangled cords and reliance on numerous extension strips – detracts from the overall professionalism and aesthetic appeal of the workspace . A cluttered and poorly managed environment can create a negative impression on clients, visitors, and potential recruits.
Moreover, the daily frustration of dealing with inadequate power access can negatively impact employee morale and satisfaction . Providing a seamless and functional work environment, including reliable and convenient access to power, is increasingly important for attracting and retaining talent in a competitive market.
IV. Conclusion: The Quantifiable Imperative for Modernizing Office Power Infrastructure
The analysis presented in this report demonstrates that outdated, inflexible AC power infrastructure imposes a significant and multifaceted financial burden on commercial office operations. This burden manifests in several quantifiable ways:
Wasted Real Estate: Inflexible power limits layout adaptability, contributing to the chronic underutilization of expensive office space. This translates to estimated annual costs of $1.51 to $1.81 per square foot ($15,100 to $18,100 per 10,000 sq ft) purely due to power-related layout constraints.
Excess Energy Consumption: Inherent inefficiencies in AC-to-DC conversion and parasitic energy drain from devices plugged into always-on outlets result in continuous energy waste. This equates to an estimated annual cost of approximately $0.26 per square foot ($2,640 per 10,000 sq ft).
High Reconfiguration Costs: Adapting office layouts becomes excessively costly and disruptive due to fixed power points. The indirect cost of lost productivity during electrical work often outweighs direct labor and material costs, with a single reconfiguration cycle potentially costing tens of thousands of dollars for even moderately sized spaces.
Safety Risks: Tangled cords resulting from inadequate outlets create significant trip-and-fall hazards, contributing to costly workplace injuries and potential liability. Fire risks from overloaded circuits or aging wiring also increase.
Crucially, these issues are interconnected and compound each other. The inability to easily reconfigure space (due to power inflexibility) exacerbates underutilization and makes addressing parasitic loads more difficult. The need for extension cords creates safety hazards. The energy waste adds a constant operating expense.
Therefore, modernizing office power infrastructure should be viewed not merely as an optional upgrade or a simple cost-saving measure, but as a strategic investment. Implementing flexible, efficient power distribution systems directly addresses the quantified problems of wasted space, energy loss, disruptive churn, and safety hazards. Such modernization enables greater operational efficiency, supports employee well-being and productivity, enhances safety, and, critically, unlocks the organizational agility required to adapt and compete effectively in the evolving landscape of work. The quantifiable costs associated with inaction provide a compelling case for prioritizing investment in modern power solutions.
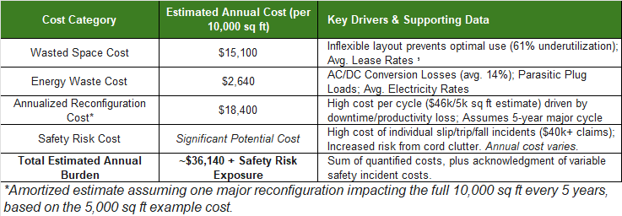
Table 4: Summary of Estimated Annual Costs Associated with Inefficient/Inflexible AC Power Infrastructure (Illustrative 10,000 sq ft Office)
V. Aggregate National Impact: Scaling the Costs
The per-square-foot costs associated with inflexible and inefficient power infrastructure, when scaled across the vast landscape of U.S. commercial office space, represent a substantial national economic burden. While precise figures for the total square footage of all U.S. office space vary, data from BOMA International indicates that the 85 major markets they track encompass approximately 8.6 billion square feet of private-sector office space. Using this figure as a significant representation of the national office inventory, we can estimate the aggregate annual impact:
Estimated National Annual Cost of Wasted Space (due to Power Inflexibility):
8.6 billion sq ft * $1.51/sq ft (Avg. Wasted Cost) = ~$12.99 Billion
Estimated National Annual Cost of Energy Waste (AC/DC Conversion & Parasitic Loads):
8.6 billion sq ft * $0.264/sq ft (Avg. Energy Waste Cost) = ~$2.27 Billion
These calculations suggest that, across the major U.S. office markets alone, inflexible power infrastructure contributes to nearly $13 billion in wasted real estate costs annually due to suboptimal space utilization. Furthermore, the energy inefficiencies inherent in traditional AC power distribution and conversion result in an estimated $2.27 billion in excess energy costs each year.
These are estimations based on the market data and the per-square-foot cost derivations detailed earlier in this report. The actual national totals could be higher when considering the full inventory of U.S. office space beyond the specific markets included in the BOMA data. Nonetheless, these figures underscore the significant, nationwide financial drain imposed by outdated office power infrastructure.
Works cited
Assessing and Reducing Plug and Process Loads in Office Buildings - NREL, accessed May 8, 2025, https://www.nrel.gov/docs/fy20osti/76994.pdf
10 Most Common Electrical Problems In The Office, accessed May 8, 2025, https://wiremanelectric.ca/blog/what-are-the-10-most-common-electrical-problems-in-the-office/
2025 Commercial Real Estate Outlook: Will Offices Recover ..., accessed May 8, 2025, https://www.rentastic.io/blog/2025-commercial-real-estate-outlook-office-recovery
External Power Supplies | ENERGY STAR, accessed May 8, 2025, https://www.energystar.gov/products/spec/external_power_supplies_spec_pd
Space Utilization +Metrics – Team #2 - CoreNet Global, accessed May 8, 2025, https://www.corenetglobal.org/docs/default-source/default-document-library/pdf/space-utilization-metrics-team2-report.pdf?sfvrsn=caaacd6b_1
Economic Costs of Utility Disruptions: Why Preparedness Matters - ACRT, accessed May 8, 2025, https://acrt.com/articles/economic-costs-of-utility-disruptions-why-preparedness-matters/
Endpoint Use Efficiency Comparison for AC and DC Power ... - MDPI, accessed May 8, 2025, https://www.mdpi.com/1996-1073/14/18/5863
A Robust Statistical Methodology for Measuring Enterprise Agility - MDPI, accessed May 8, 2025, https://www.mdpi.com/2076-3417/13/14/8445
Enterprise agility: Buzz or business impact? - McKinsey & Company, accessed May 8, 2025, https://www.mckinsey.com/capabilities/people-and-organizational-performance/our-insights/enterprise-agility-buzz-or-business-impact
The Future Is Flexible - Steelcase, accessed May 8, 2025, https://www.steelcase.com/research/articles/topics/hybrid-work/future-flexible/
Understanding the Financial Impact of Electrical Downtime in Commercial Spaces, accessed May 8, 2025, https://starneselectricllc.com/understanding-the-financial-impact-of-electrical-downtime-in-commercial-spaces/
CoreNet Global Hackathon: Space Utilization & Metrics in the Workplace Following COVID-19 | SmithGroup, accessed May 8, 2025, https://www.smithgroup.com/perspectives/2020/WO/corenet-global-hackathon-space-utilization-metrics-in-the-workplace-following
How Downtime With Information Systems Can Cost Business Thousands In Lost Opportunity, accessed May 8, 2025, https://www.orionnetworks.net/how-downtime-with-information-systems-can-cost-business-thousands-in-lost-opportunity/
How Many People Suffer from Slips, Trips and Falls at Work? - Human Focus, accessed May 8, 2025, https://humanfocus.co.uk/blog/how-many-people-suffer-from-slips-trips-and-falls-at-work/
BOMA 2022 OFFICE MARKET STUDY, accessed May 8, 2025, https://boma.org/wp-content/uploads/2025/01/BOMA-2022-Office-Market-Study.pdf